
 Remember those maps after the 2004 election that showed a new "cartogram" of the US, to help ease the anxiety of liberals like me who saw a whole sea of red on the map? This "cartogram" weighted each state according to its population, rather than geographic size, and suddenly the US was half red and half blue; or even slightly more blue. Well, I came across these other maps--looking at social and economic cosmology--today from the same Mark Newman, at the University of Michigan. Very interesting. Very interesting how, of all places, South America seems to contribute very little in terms of greenhouse gas emissions, and take very little resources, in proportion to their population. You can find the maps, and their interpretation here .
12.03.2006
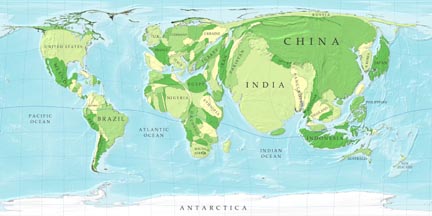
Images of the Social and Economic World
Remember those maps after the 2004 election that showed a new "cartogram" of the US, to help ease the anxiety of liberals like me who saw a whole sea of red on the map? This "cartogram" weighted each state according to its population, rather than geographic size, and suddenly the US was half red and half blue; or even slightly more blue. Well, I came across these other maps--looking at social and economic cosmology--today from the same Mark Newman, at the University of Michigan. Very interesting. Very interesting how, of all places, South America seems to contribute very little in terms of greenhouse gas emissions, and take very little resources, in proportion to their population. You can find the maps, and their interpretation here .
Subscribe to:
Post Comments (Atom)


1 comment:
Thanks, This is really interesting:
Russia and Eastern Europe are economically insignificant, but significant producers of greenhouse gasses. AIDS is a larger problem in India than I had imagined. Saudi Arabia, with a miniscule population, not only produces, but also consumes a lot of oil (and produces a lot of greenhouse gasses)
There are, however, some things that I doubt, since statistics are probably hard to get: Is AIDS a significantly smaller problem in Congo (DRC) than it is in Kenya or Tanzania? I can only believe that statistics are harder to get from the Congo.
Post a Comment